Data Visualization
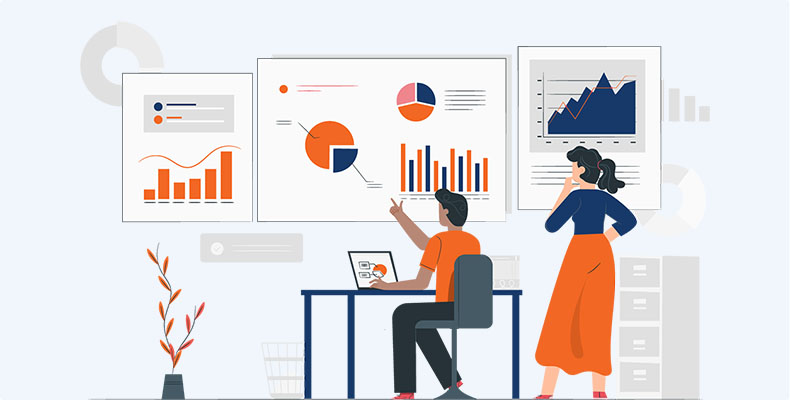
Data visualization is the graphical representation of information and data. By using visual elements like charts, graphs, and maps, data visualization tools provide an accessible way to see and understand trends, outliers, and patterns in data.
Data visualization is going to change the way our analysts work with data. They’re going to be expected to respond to issues more rapidly. And they’ll need to be able to dig for more insights – look at data differently, more imaginatively. Data visualization will promote that creative data exploration.
Data visualization is another form of visual art that grabs our interest and keeps our eyes on the message. When we see a chart, we quickly see trends and outliers. If we can see something, we internalize it quickly. It’s storytelling with a purpose. If you’ve ever stared at a massive spreadsheet of data and couldn’t see a trend, you know how much more effective a visualization can be.
Benefit of Services
Data visualization helps business stakeholders analyze reports regarding sales, marketing strategies, and product interest. Based on the analysis, they can focus on the areas that require attention to increase profits, which in turn makes the business more productive.
- Better analysis
- Quick action
- Identifying patterns
- Finding errors
- Understanding the story
- Exploring business insights
- Grasping the Latest Trends
What Is Included
- Data positioning
- Bars over circle and squares
- Use of colour theory
- Reducing chart junk by avoiding 3D charts and eliminating the use of pie charts to show proportions
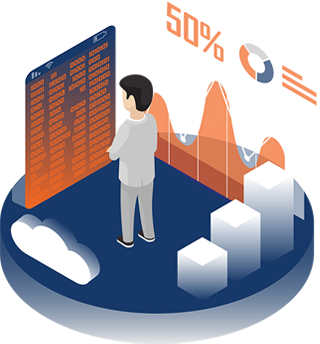
Data visualization is the graphical representation of information and data. By using visual elements like charts, graphs, and maps, data visualization tools provide an accessible way to see and understand trends, outliers, and patterns in data.
Data visualization provides a quick and effective way to communicate information in a universal manner using visual information. The practice can also help businesses identify which factors affect customer behavior; pinpoint areas that need to be improved or need more attention; make data more memorable for stakeholders; understand when and where to place specific products; and predict sales volumes.
- the ability to absorb information quickly, improve insights and make faster decisions;
- an increased understanding of the next steps that must be taken to improve the organization;
- an improved ability to maintain the audience’s interest with information they can understand;
- an easy distribution of information that increases the opportunity to share insights with everyone involved;
- eliminate the need for data scientists since data is more accessible and understandable; and
- an increased ability to act on findings quickly and, therefore, achieve success with greater speed and less mistakes.