Report Development
Reporting means collecting and presenting data so that it can be analyzed. When we talk about reporting in business intelligence (BI), we are talking about two things. One is reporting strictly defined. The other is “reporting” taken in a more general meaning. In the first case, reporting is the art of collecting data from various data sources and presenting it to end-users in a way that is understandable and ready to be analyzed. In the second sense, reporting means presenting data and information, so it also includes analysis–in other words, allowing end-users to both see and understand the data, as well as act on it.
BI reporting—preparing, analyzing, and portraying business metrics—is fundamental to every business
Reporting can be classified in many different ways. One is to differentiate reporting by the role of the person(s) preparing the report: managed reporting is reporting prepared by technical personnel such as developers; ad-hoc reporting is instead the realm of the nontechnical end-user. Another way in which reporting can be classified is by identifying the most important features of a report, such as data tables, cross-tab reports, visualization features, etc.

Benefit of Services
Reporting is the necessary prerequisite of analysis; as such, it should be viewed in light of the goal of making data understandable and ready for easy, efficient and accurate analysis.
- Increasing the workflow speed
- Implementation in any industry or department
- Utilization of real-time and historical data
- Customer analysis and behavioral prediction
- Operational optimization and forecasting
- Cost optimization
- Informed strategic decision-making
- Streamlined procurement processes
- Enhanced data quality
- Human resources and employee performance management
What Is Included
BI reporting tools pull and read data from your company’s data sources, on premises and in the cloud. The reporting tool is able to identify measurements such as sales, revenue, inventory counts, etc. and apply dimensions such as date, purchase order, or customer information to create analyses. Users can choose dimensions and measurements using drag-and-drop functionality to create reports.
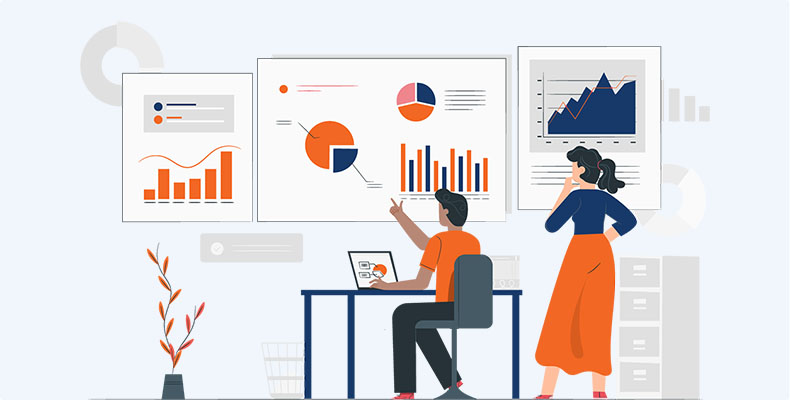
Team can create tables, histograms or pie charts depending on the data chosen and create forecasting models. They can also create dashboards with these charts and have them update on a schedule or in near real-time. There are a variety of possibilities and capabilities in BI reporting.
While BI reporting will be specific to your company’s needs, there are some noted best practices in business intelligence reporting. Keep these in mind as you develop your reporting process:
- Choose the correct audience for the reports and work with IT to set up permissions
- Prepare the report with analysis in mind. How can this report be easily understood?
- Learn how to create effective data visualizations
- Be willing to adapt your BI reporting process to advances in technology and changes in business needs
You can start driving change in your organization with business intelligence.
If the flowchart of business intelligence is to see, understand and act upon data, reporting’s goal is the first–to enable end-users to see data so that they can analyze it and make it understandable through analysis. Reporting deals with data, while analysis is what turns the data into information.
For example, a sales report may include rows representing sales reps and columns showing orders taken, units sold of each major product line, revenue-dollars generated, percentage of target achieved, etc
